Know where the money and the members are going
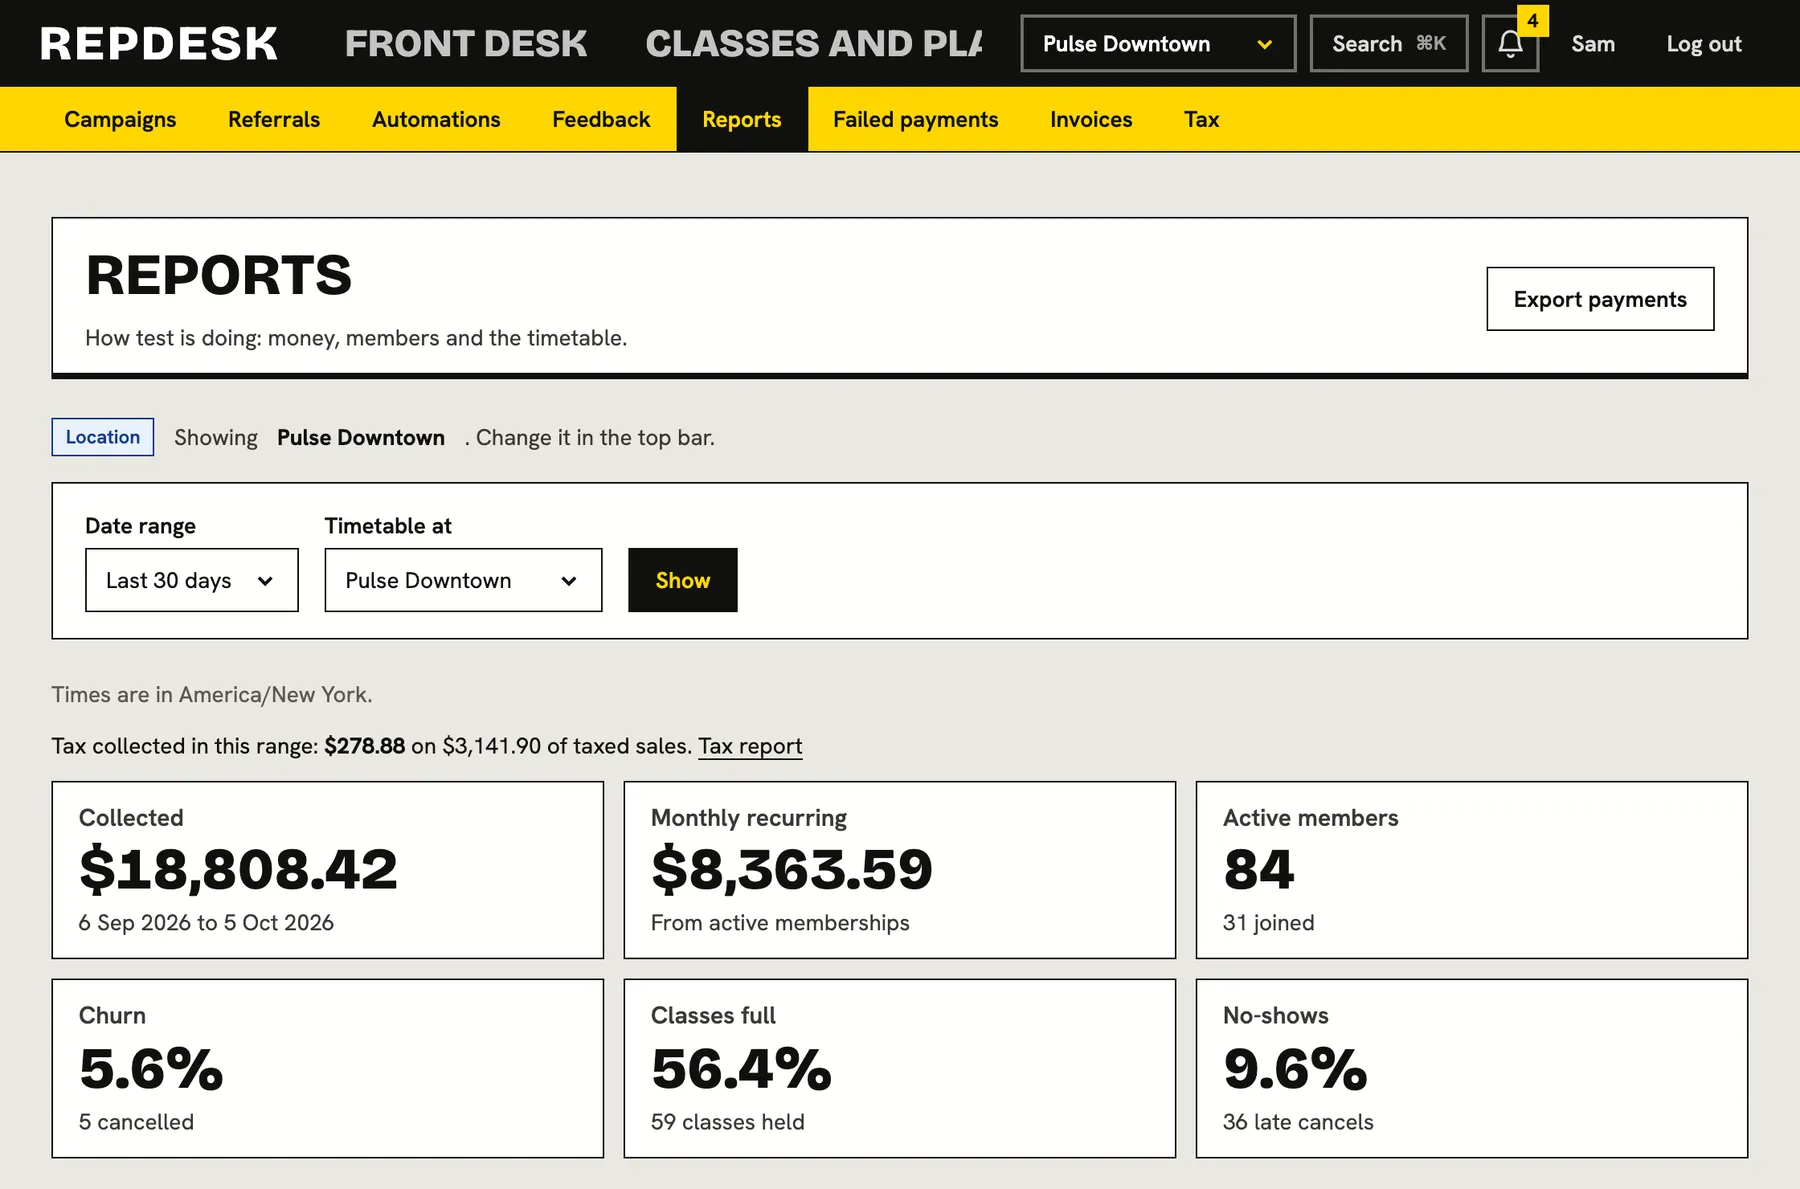
Pick a date range and see what you collected, how recurring revenue stands, who is leaving, how full classes are and when people actually come. Everything is by location, in your time zone, and exportable.
If you need a spreadsheet and an afternoon to answer how the month went, you will not ask often enough.
The headline numbers first
Six tiles answer the big questions: money collected, monthly recurring revenue from active memberships, active members and new joiners, churn, how full classes are, and no-shows. Anything needing attention, like past due memberships or failed payments, is called out.
- Presets for 7, 30 and 90 days or this month, or a custom range
- Filter to one location or see all of them
- Show the chart as a table for accessibility and copying
Where the revenue comes from
See money collected each day, then broken down by what was sold and by plan, so you know which offers carry the business.
- Daily collected revenue
- Revenue by type and by plan
- Outstanding and failed payments, with the amount owed
- Tax collected for the range, with a full tax report
What fills the room
Your top classes show bookings and how full they ran. A heatmap of bookings by weekday and hour shows the busiest times, which tells you when to add a class and when to cut one.
- Fill rate and classes held
- No-show and late cancel rates
- Busy times by weekday and hour
The rest of the picture
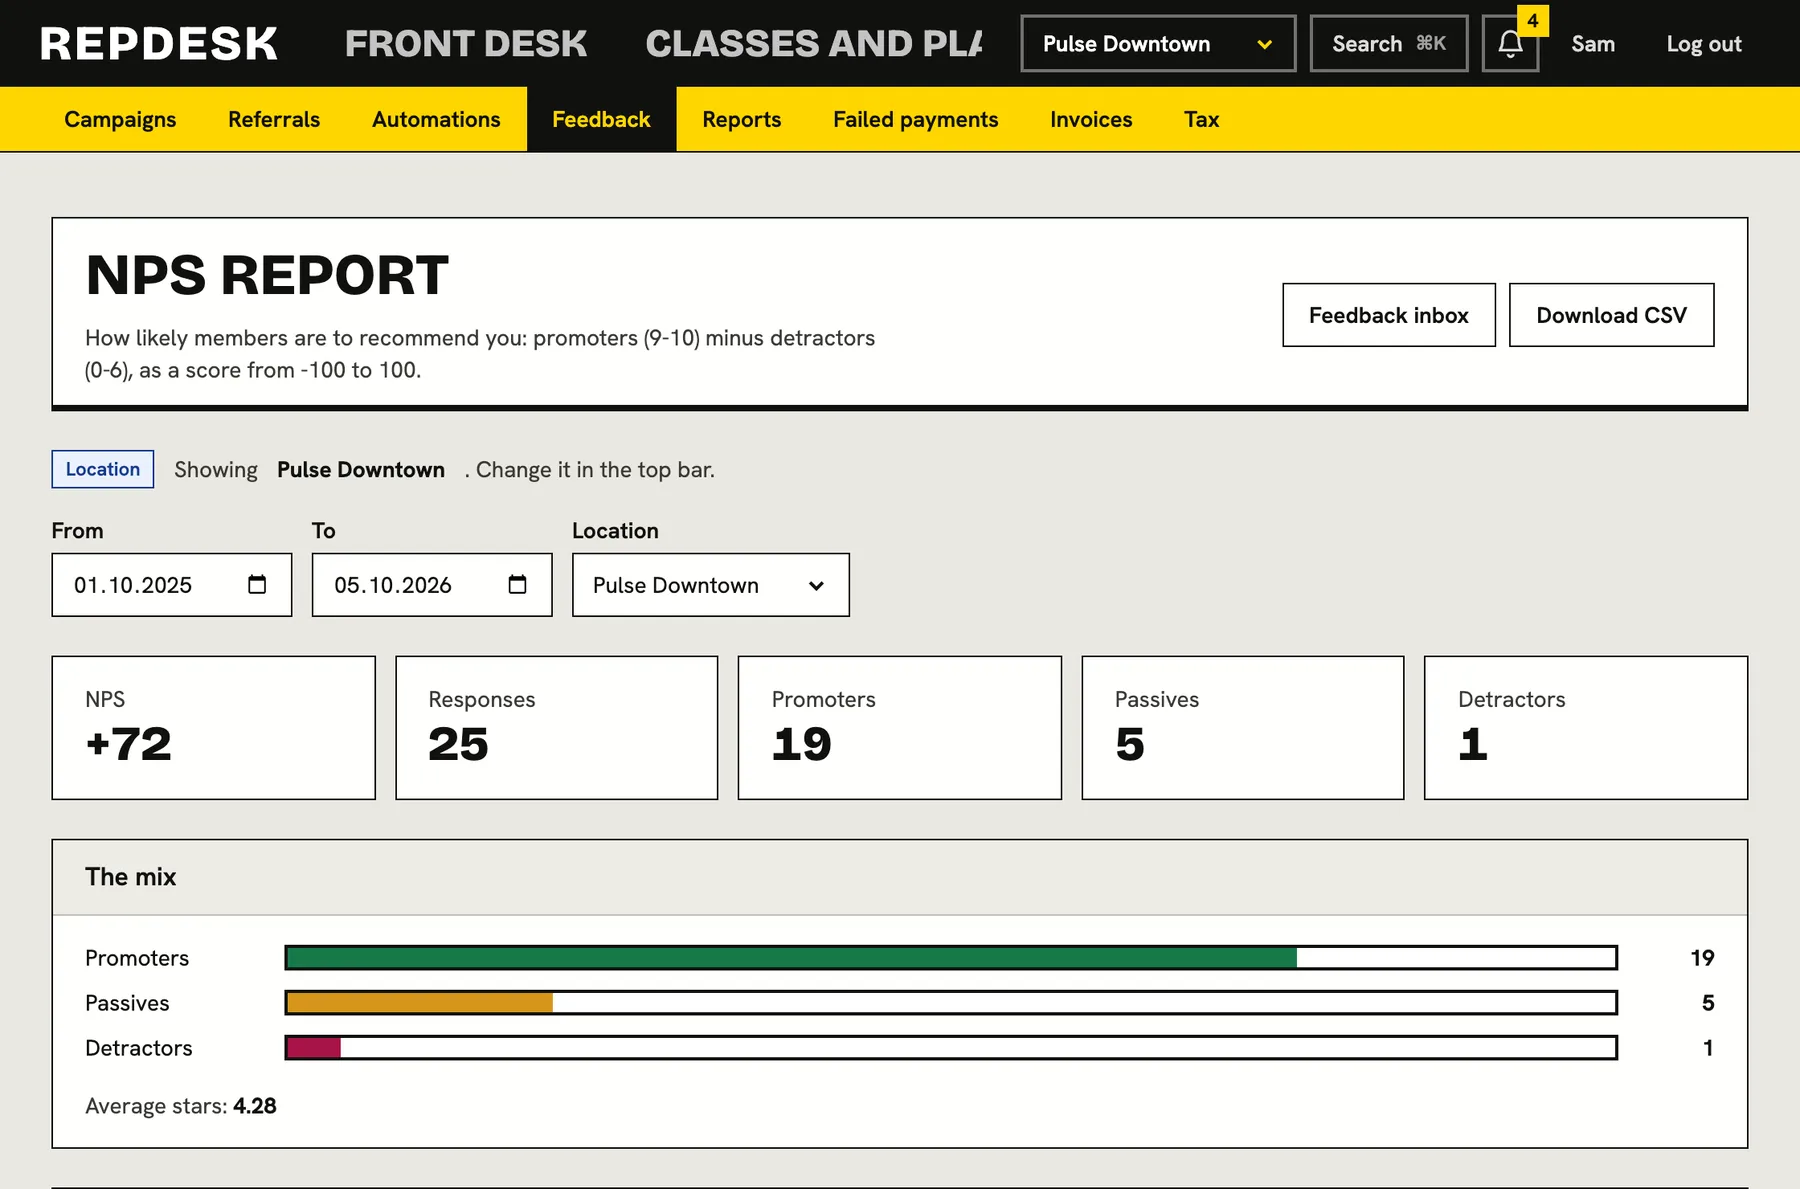
Two more reports sit alongside. The leads report shows funnel, sources, conversion and why leads were lost. The feedback report shows NPS by location and by month.
- Leads: new, joined, conversion rate and days to convert
- NPS: promoters, passives, detractors and trend
- Export payments as a CSV for your accountant
A five minute Monday
-
Minute 1
Check the tiles
Collected, recurring revenue, churn and fill rate.
-
Minute 2
Read the attention list
Past due memberships and failed payments.
-
Minute 3
Look at busy times
Where are you full, and where are you empty?
-
Minute 5
Open leads and NPS
Who is joining, and how do members feel?
Works together with
Questions
Are the figures the same as the ones I export?
Yes. The screen, the export and the integrations all use the same calculations.
Can managers see all locations?
Reports follow each person's location access. The payments export is for people with access to the whole business.
Can I give my accountant the tax numbers?
Yes. The tax report is available with the reports and payments can be exported as a CSV.
Can my team see reports?
Owners and managers can by default. Access is controlled per role.
Do times match my studio's time zone?
Yes. Dates and hours use your business's own time zone.